Coda TimeSeries Library
This will be the future site of coda timeseries library documentation, and the CodaApp TornadoFx application for browsing COVID-19 timeseries data from public sources.
Package Structure
The following two modules provide the core API for working with timeseries data in the coda library:
coda-areadefines classes for keeping tracking of areas of varying geographic levels (state, county, national, etc.)coda-timedefines classes for managing timeseries data, as well as some I/O operations
The following four modules provide specific functionality and data associated with these:
coda-area-usaprovides a common baseline of US census and related data (2019 census)coda-time-usaprovides utilities for working with US timeseries data, for instance rolling up values from county to state levelcoda-time-covidprovides tools for loading and working with some specific COVID-19 datasets (including JHU CSSE COVID-19 data from and several forecasting data sources)coda-appis a JavaFx application (built using TornadoFx) with views depicting historical data and forecasts
In addition, there is a utility module coda-utils for general-purpose utilities.
TimeSeries Model and Data Structure
When working with COVID (and similar) data, there are hundreds of different metrics where daily measurements or observations are important to track, although almost always a series of operations needs to be applied for any kind of analysis or presentation (e.g. 7-day averages). The coda-time module is designed to provide a common baseline for the most common timeseries aggregations, derivations, and other analytics, and also provides efficient storage utilities.
Reporting a single value in this context (hundreds of metrics, thousands of areas) involves three steps: (i) select the timeseries (by source, area, metric), (ii) make any intermediate operations on that series, and (iii) sample the value. Prior to timeseries selection, one might also need operations on a “cohort” of many timeseries (e.g. median across areas), or a derivation of a new timeseries from several others (e.g. positive tests divided by total tests).
A TimeSeries is a data structure that stores a set of values by dates, associated with some information about where the data comes from and what it references. It has the following fields:
- source/metric/area information - uniquely specifies a time series
- data source
- area
- metric
- qualifier (e.g. to break metric up into demographic segments)
- value information
- default value (used for missing data)
- start date
- list of values relative to start date
- intSeries - flag indicating whether values should be understood as doubles or integers
In general, timeseries may also specify values by hour, month, etc. or by specific timestamps, but these are not yet supported.
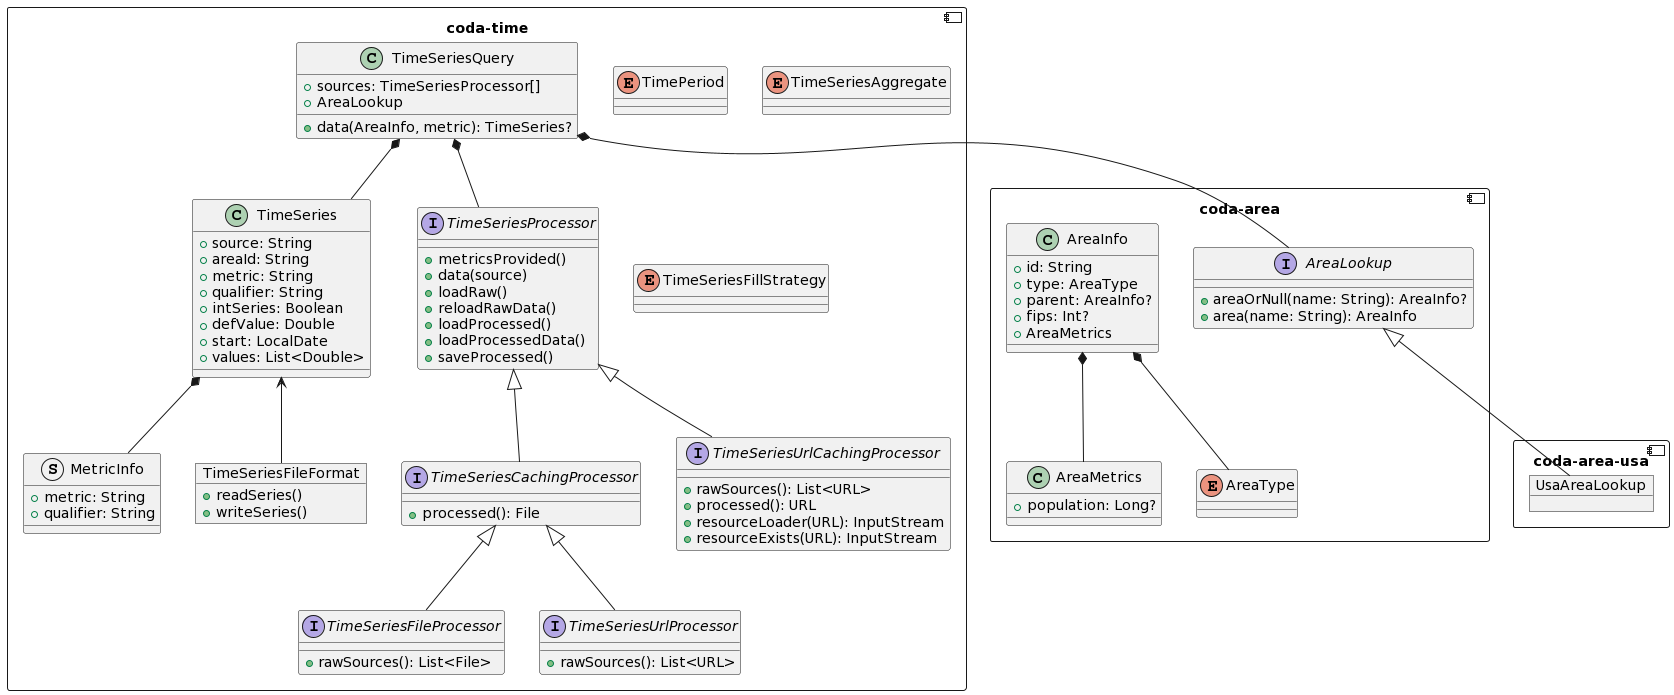
The APIs for timeseries and area are defined within the coda-area and coda-time modules, as shown here:
CodaApp
CodaApp is a data exploration JavaFx tool written using TornadoFx. It was initially written early in the COVID-19 pandemic (Spring and Summer 2020), so contains an emphasis on understanding of data early in the pandemic, within the first wave. However, it can still be used to load and display the most recent data available from the JHU CSSE COVID-19 dataset.
Currently, the tool has four tabs:
- Historical Data for browsing and filtering case and death data by country, state, metro area (CBSA), and county
- Hotspots for ranking geographic areas by a given metric, with an expansive table showing trends, peaks, and more
- Forecast Tool for browsing forecasts by date and time against real data
- Forecast Table for comparing performance of multiple forecasts